About TraderCode Technical Indicators
TraderCode is a very useful toolbox for stock traders. You can use it to compute technical indicator values for stock prices and plot them in Excel. It includes an Excel Add-In that provides an user interface for you to...
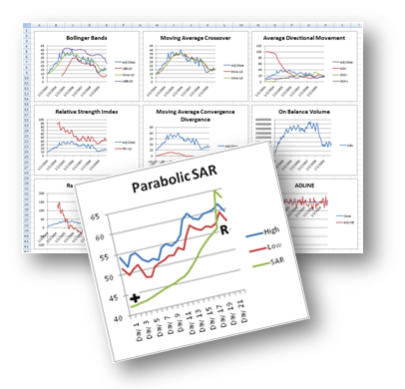
TraderCode is a comprehensive library of technical indicators and technical analysis functions for use with Microsoft Excel. It allows you to create many types of technical indicators used in trading systems like Moving Average, Bollinger Bands, Oscillators, True Range, Standard Deviation, Donchian Channels and many more. With these indicators you can easily perform end-of-day analysis or back-testing of historical stock data.
Technical Analysis Add-In and Formulas
The Analysis Add-In and Formulas form the foundation of TraderCode since the first version of this popular software. The Add-In allows a user without any prior experience to quickly and easily create technical indicators from a user interface wizard. It also performs validation of the data, allows specification of where the output is to be located and guiding the user in creating the indicators accurately.
Technical Analysis Expert
The Analysis Expert is a spreadsheet model that allows you to create your own trading system based on the different technical indicators. It is able to help you download data, create multiple technical indicators, vary the parameters and repeat the tasks from within a spreadsheet environment quickly and easily. With a single click of a button, repeatable analysis can be carried out on different equity assets or stocks.
Backtesting Expert
The Backtesting Expert is a spreadsheet model that allows you to create trading strategies using the technical indicators and running the strategies through historical data. The performance of the strategies can then be measured and analyzed quickly and easily.
Point-and-Figure Charting Expert
Point-and-Figure charting is an analysis technique that has been around for many years. It has recently become very popular among traders and investors. This technical analysis technique uses a chart with "X"s and "O"s for predicting financial asset prices.
Previous Versions
Here you can find the changelog of TraderCode Technical Indicators since it was posted on our website on 2015-04-28 03:00:00.
The latest version is 5.0 and it was updated on 2024-04-23 08:39:17. See below the changes in each version.
TraderCode Technical Indicators version 5.0
Updated At: 2010-11-10
Changes: Pivot Points
TraderCode Technical Indicators version 1.1
Updated At: 2008-10-24
Changes: New Release
Disclaimer
External Download
We do not host TraderCode Technical Indicators on our servers. We did not scan it for viruses, adware, spyware or other type of malware. This app is hosted by the software publisher and passed their terms and conditions to be listed there. We recommend caution when installing it.
The external download link for TraderCode Technical Indicators is provided to you by apps112.com without any warranties, representations or guarantees of any kind, so access it at your own risk.
If you have questions regarding this particular app contact the publisher directly. For questions about the functionalities of apps112.com contact us.